Top 100 Beverage Companies of 2016
Anheuser-Busch InBev takes back No. 1 spot


Once again The Coca-Cola Co. and Anheuser-Busch InBev (AB InBev) are flipping positions to claim the top spot in Beverage Industry’s annual Top 100 Report. Based on 2016 financial sales, AB InBev reclaimed the No. 1 spot as sales were up more than $2 billion compared with 2015 financial sales. With its merger with SABMiller finalized in late 2016, one can presume that the international brewer will rest comfortably in the No. 1 spot for years to come. SABMiller will not be the only company that won’t appear on next year’s list as notable mergers and acquisitions continue throughout 2017. Already Danone Group completed its acquisition of WhiteWave Foods Co. and Heineken N.V. purchased the remaining 50 percent stake in Lagunitas Brewing Co. Regarding the halfway point, the list continued to show growth as Rockstar Inc. finished 2016 with $726 million in sales for the No. 50 spot. This is up from the estimated $667 million by Trinchero Family Estates based on 2015 financial sales.
Click here to view the 2016 Top 100 beverage companies list.
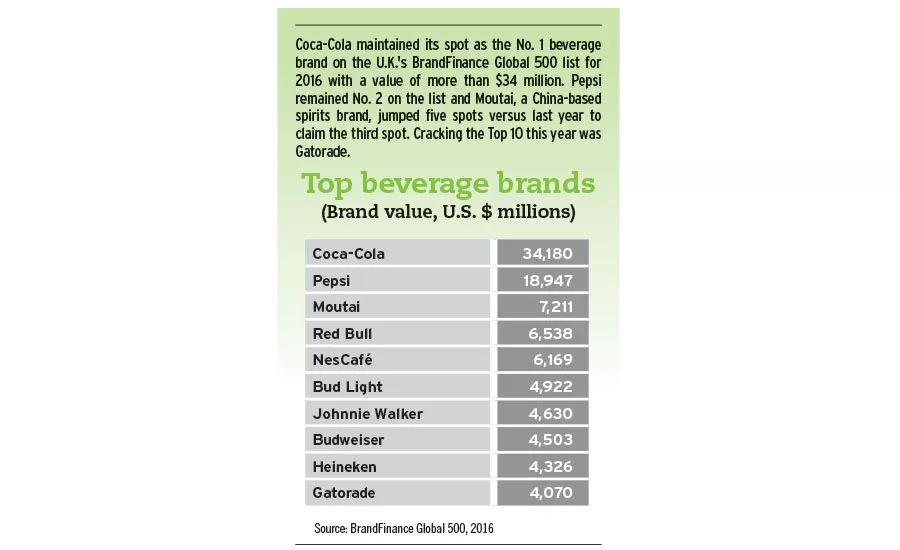
Coca-Cola maintained its spot as the No. 1 beverage brand on the U.K.'s BrandFinance Global 500 list for 2016 with a value of more than $34 million. Pepsi remained No. 2 on the list and Moutai, a China-based spirits brand, jumped five spots versus last year to claim the third spot. Cracking the Top 10 this year was Gatorade.
| Coca-Cola | 34,180 |
|---|---|
| Pepsi | 18,947 |
| Moutai | 7,211 |
| Red Bull | 6,538 |
| NesCafe | 6,169 |
| Bud Light | 4,922 |
| Johnnie Walker | 4,630 |
| Budweiser | 4,503 |
| Heineken | 4,326 |
| Gatorade | 4,070 |
Source: BrandFinance Global 500, 2016
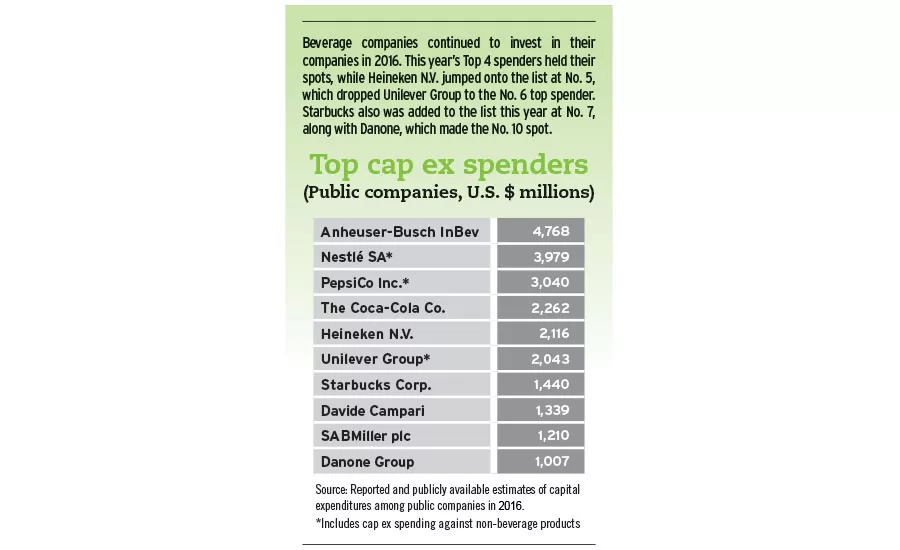
Beverage companies continued to invest in their companies in 2016. This year’s Top 4 spenders held their spots, while Heineken N.V. jumped onto the list at No. 5, which dropped Unilever Group to the No. 6 top spender. Starbucks also was added to the list this year at No. 7, along with Danone, which made the No. 10 spot.
| Anheuser-Busch InBev | 4,768 |
|---|---|
| Nestlé SA* | 3,979 |
| PepsiCo Inc.* | 3,040 |
| The Coca-Cola Co. | 2,262 |
| Heineken N.V. | 2,116 |
| Unilever Group* | 2,043 |
| Starbucks Corp. | 1,440 |
| Davide Campari | 1,339 |
| SABMiller plc | 1,210 |
| Danone Group | 1,007 |
Source: Reported and publicly available estimates of capital expenditures among public companies in 2016.
*Includes cap ex spending against non-beverage products
Fans are coming out in masses to support their favorite beverage brands on social media. Consumers continue to show their love, or should we say "like," through Facebook. Coca-Cola reached a milestone by surpassing the 100 million mark. This year also saw Dr Pepper fall off the list while Jack Daniels made an appearance at No. 10.
| Coca-Cola | 104,276,777 |
|---|---|
| Red Bull | 46,690,530 |
| Starbucks | 36,723,771 |
| Pepsi | 36,508,136 |
| NesCafé | 35,526,980 |
| Monster Energy | 25,641,154 |
| Heineken | 22,768,163 |
| Sprite | 22,195,438 |
| Fanta | 19,141,730 |
| Jack Daniels | 15,641,181 |
Source: Search conducted May 10, according to socialbakers.com and individual page visits.
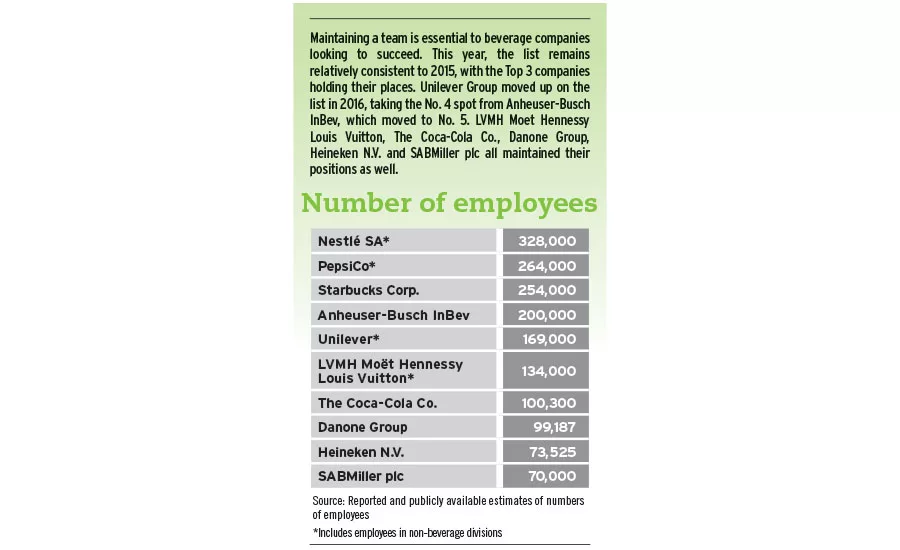
Maintaining a team is essential to beverage companies looking to succeed. This year, the list remains relatively consistent to 2015, with the Top 3 companies holding their places. Unilever Group moved up on the list in 2016, taking the No. 4 spot from Anheuser-Busch InBev, which moved to No. 5. LVMH Moet Hennessy Louis Vuitton, The Coca-Cola Co., Danone Group, Heineken N.V. and SABMiller plc all maintained their positions as well.
| Nestlé SA | 328,000 |
|---|---|
| PepsiCo Inc.* | 264,000 |
| Starbucks | 254,000 |
| Anheuser-Busch InBev | 200,000 |
| Unilever* | 169,000 |
| LVMH Moet Hennessy Louis Vuitton* | 134,000 |
| The Coca-Cola Co. | 100,300 |
| Danone Group | 99,187 |
| Henieken N.V. | 73,525 |
| SABMiller plc | 70,000 |
Source: Reported and publicly available estimates of numbers of employees
*Includes employees in non-beverage divisions.
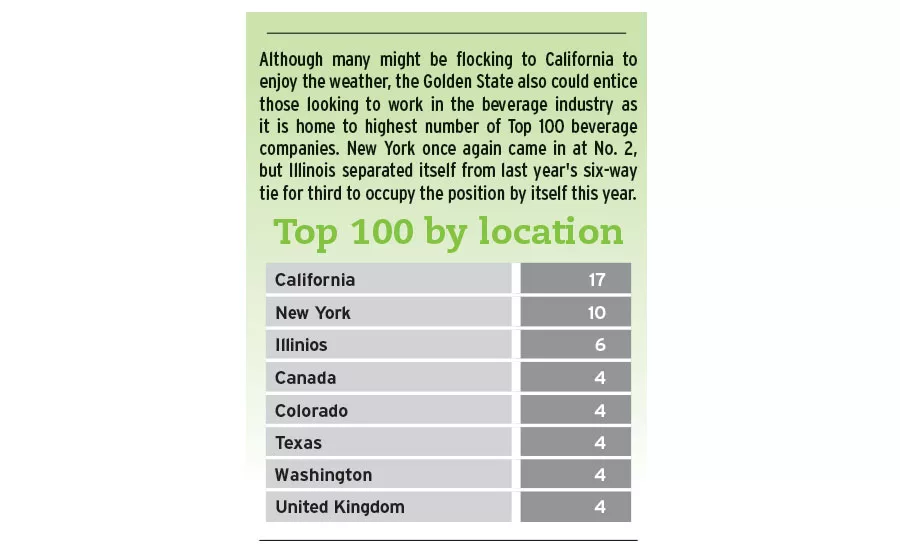
Although many might be flocking to California to enjoy the weather, the Golden State also could entice those looking to work in the beverage industry as it is home to highest number of Top 100 beverage companies. New York once again came in at No. 2, but Illinois separated itself from last year's six-way tie for third to occupy the position by itself this year.
| California | 17 |
|---|---|
| New York | 10 |
| Illinios | 6 |
| Canada | 4 |
| Colorado | 4 |
| Texas | 4 |
| Washington | 4 |
| United Kingdom | 4 |
*Michigan, Pennsylvania and Texas also have three.
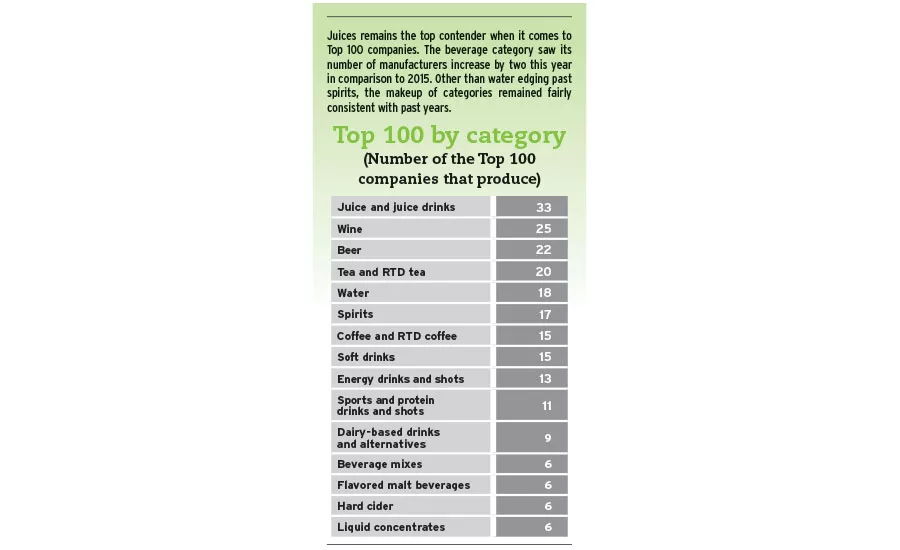
Juices remains the top contender when it comes to Top 100 companies. The beverage category saw its number of manufacturers increase by two this year in comparison to 2015. Other than water edging past spirits, the makeup of categories remained fairly consistent with past years.
| Juice and juice drinks | 33 |
|---|---|
| Wine | 25 |
| Beer | 22 |
| Tea and RTD tea | 20 |
| Water | 18 |
| Spirits | 17 |
| Coffee and RTD coffee | 15 |
| Soft drinks | 15 |
| Energy drinks and shots | 13 |
| Sports and protein drinks and shots | 11 |
| Dairy-based drinks and alternatives | 9 |
| Beverage mixes | 6 |
| Flavored malt beverages | 6 |
| Hard cider | 6 |
| Liquid concentrates | 6 |
Click here to view the 2016 Top 100 beverage companies list.
Looking for a reprint of this article?
From high-res PDFs to custom plaques, order your copy today!


