The 2013 State of the Beverage Fleet Industry
Results reflect shift to end-load trailers


Beverage Industry recently surveyed a sample of its readers to gain insight into the size and makeup of current delivery fleets, future vehicle purchase plans, as well as operational concerns and strategies. Among the key findings were a smaller than usual average fleet size, a more hands-on group of executives, an extension of replacement cycles, and in some cases, a mismatch between concerns and strategies.
Long-term shifts in vehicle types and config-urations held consistently, while the split between some types was uniquely reflective of our readers’ operations.
Vehicular variables
The split between light-duty vehicles (passenger cars, SUVs, pickups and vans) and medium- and heavy-duty vehicles showcases respondents’ entrepreneurial operations. Among survey-takers, nearly as many light-duty vehicles are in use as medium- and heavy-duty vehicles. Future purchase plans also reflect this near-even split between light-duty and medium- and heavy-duty vehicles.
The continuing industry shift from side-load to end-load equipment and from straight-trucks to tractor-trailers also is reflected in survey responses. Although individual side-load vehicle types slightly outnumber individual end-load types in current fleets, the overall split between side-load and end-load favors the end-load equipment. For future purchases, the split widens tremendously, with an overwhelming preference in favor of end-load equipment. Similarly, tractor-trailer configurations in current fleets and future purchase plans outnumber the straight-trucks.
For future purchase plans, roughly two-thirds of planned purchases represent replacement of existing vehicles, with the balance reflecting expansion of current fleets, according to survey respondents. These reported replacements were based on a two-year period, which translates to a replacement cycle of roughly 12 years. This is quite a bit longer than the long-term industry average of seven to 10 years, based on interviews that I have compiled in the approximately 20 years of reporting on fleet operations.
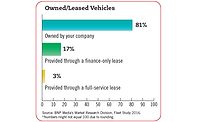
When it comes to ownership versus leasing, slightly more than two-thirds of companies own their vehicles. Twelve percent use full-service leases, and 5 percent use finance-only leases, according to survey results.
Maintenance and downtime
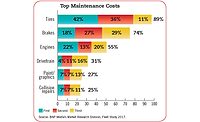
Tires and brakes rank as the Top 2 maintenance costs for the majority of respondents. Engine maintenance follows closely behind in third place, which could be because of longer replacement cycles that many fleets have employed in reaction to the economic conditions experienced during the last five years.
Engine and drivetrain failures rank as the Top 2 causes of downtime and unplanned repairs, which likely is another symptom of longer replacement cycles, while collision repairs rank third on the downtime scale. This potentially points to the smaller fleets being less able to compete for the most experienced drivers.
Operational concerns
In spite of relatively stable fuel prices during the last 12 months, fuel price volatility ranks as the top operational concern of respondents by a large margin with
66 percent citing it as a top concern. This is especially curious given that, among the available fuel cost reduction strategies, those that address price volatility rank comparatively low on the scale, according to the survey. Insurance and vehicle lifecycle costs follow in second and third place for operational concerns. This heightened cost sensitivity points to the smaller company size of many of the survey’s respondents.
Fuel cost strategies
By a four-to-one margin compared with the next highest option, route optimization is the most popular fuel cost reduction strategy among respondents. Although replacing older trucks — a distant second-place fuel-saving option — is far more costly than route optimization, driver training and coaching — the third-place option — is not a costly choice. Considering that a driver can impact fuel economy by as much as 30 percent, employing driver training and coaching deserves much more consideration as a fuel-saving strategy.
Beverage Industry’s Fleet Study was conducted by BNP Media’s Market Research Division. The online survey was conducted between Nov. 7 and 21, 2013, and included a systematic random sample of the domestic circulation of Beverage Industry.Geographically, respondents were well-distributed across the United States, with a slightly stronger showing in the Northeast and Southern regions. Half of the respondents were distributors or wholesalers, and roughly one-third indicated they were producers or bottlers, with the remainder composed of retailers and other industry participants.
When it comes to operation size, more than half of the respondents reported sales of less than $5 million, and more than three-quarters had sales less than $15 million. The average fleet size among the respon-dents is just fewer than 25 vehicles. Many respondents said they are either extremely involved or very involved in logistics; however, many identified themselves as senior corporate executives rather than dedicated fleet managers. More than 60 percent of those completing the survey had 10 or more years of industry experience. Nearly 90 percent of those providing survey responses have authority to specify, recommend or approve purchases of fleet products and services.
Looking for a reprint of this article?
From high-res PDFs to custom plaques, order your copy today!


