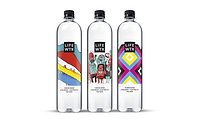
2017 State of the Beverage Industry: Bottled water top beverage based on volume sales
Sparkling, premium offerings driving growth


After years of speculation, bottled water officially is the No. 1 beverage based on volume in the United States. Earlier this year, New York-based Beverage Marketing Corporation (BMC) announced that bottled water overtook carbonated soft drinks for the top spot on a volume basis.
According to BMC’s presentation “Beverages 2017: What’s in Store,” the market research firm noted that bottled water’s volume sales increased 8.5 percent in 2016. Its share of stomach also reached 20.5 percent, up from its 15.2 percent share in 2011.
Leading to this transition, analysts highlighted numerous factors that contributed to the category’s ascension, including consumers searching for alternatives to sugary beverages.
“There [are] a lot of drivers but the No. 1 is health and wellness,” said Gary Hemphill, managing director of research for BMC, in Beverage Industry’s October 2016 issue. “If you consider the product category of bottled water, it’s virtually perfect when it comes to bottled water, so that’s been the greatest driver of bottled water performance this year and historically.”
In its January report titled “Bottled Water – US,” Chicago-based Mintel notes that the category increased 6.4 percent in dollar sales in 2016 to just shy of $16.5 billion. Although convenience/PET still water account for the largest share of the category, the sparkling segment has been a valuable growth driver that will help with bottled water’s continued climb, the market research firm notes.
“Strong sales growth in sparkling water has been key to growth from 2015 to 2016, while the convenience/PET still water segment and the jug/bulk still water segment have seen sales improve, but more modestly,” the report states. “Strong consumer interest in water as a healthy alternative to sugary and caffeinated beverages paired with growth in flavored, sparkling, and enhanced offerings have buoyed the market and should be positive drivers through 2021.”
According to Chicago-based Information Resources Inc. (IRI), the dollar sales for overall bottled water category were $15.2 billion for the 52 weeks ending May 14 in total U.S. multi-outlets and convenience stores. Convenience/PET still bottled water accounted for more than $11.7 billion, while the seltzer/sparkling/mineral segment was $2.3 billion during that same timeframe. However, sparkling was up 16 percent during that time period compared with convenience/PET, which was up 6.2 percent.
Premium offerings also have helped propel the bottled water market, according to analysts.
“Bottled water’s popularity is allowing it to quickly evolve with more premiumized offerings, which include unique water sources and more sophisticated flavors, and a heightened focus on functional waters,” said Elizabeth Sisel, former beverage analyst for Mintel, in Beverage Industry’s October 2016 issue. “There might be more opportunity with the added functions bottled waters can offer. A net of 83 percent of consumers want some sort of nutritional or functional benefit when creating their ideal bottled water. Nutritional benefits are important to bottled water consumers, as many drink bottled water for health and hydration.”
Although premium or, sometimes, ultra-premium bottled waters are helping to fuel the category, the sub-segment has been supported by the growing premiumization trend throughout the beverage market.
“On the premium side, that’s probably part of a broader trend with refreshment beverages and the alcoholic beverages that we see as well,” BMC’s Hemphill said in Beverage Industry’s October 2016 issue. “We see them trading up for ones they perceive as higher quality. I think that is part of that overriding trend that we’ve seen across the beverage industry.”
On the horizon, bottled water is expected to continue its climb. Mintel forecasts that the category will reach $23.8 billion in sales by 2021, a more than 44 percent increase from 2016. BI
Top convenience/PET still bottled waters
(Individual brands)
| Private label | $2,500,075,008 | 7.5 | 21.8 | 0.3 |
| Dasani | $1,101,267,840 | 2.4 | 9.6 | -0.4 |
| Aquafina | $1,093,463,296 | 5.6 | 9.5 | -0.1 |
| Nestlé Pure Life | $933,983,808 | 6.2 | 8.1 | 0 |
| Glacéau smartwater | $860,181,184 | 3.9 | 7.5 | -0.2 |
| Category Total* | $11,478,011,904 | 6.2 | 100 | - |
*Includes brands not listed.
Source: Information Resources Inc. (IRI), Chicago. Total U.S. supermarkets, drug stores, gas and convenience stores, mass merchandisers, military commissaries, and select club and dollar retail chains for the 52 weeks ending May 14.
Top jug/bulk still bottled waters
(Individual brands)
| Private label | $639,554,880 | 12 | 43.9 | 2.7 |
| Poland Spring | $142,242,544 | 7.5 | 9.8 | 0.2 |
| Crystal Geyser | $95,357,824 | 9.5 | 6.5 | 0.3 |
| Deer Park | $65,984,232 | 3.5 | 4.5 | -0.1 |
| Arrowhead | $64,139,060 | -5 | 4.4 | -0.5 |
| Category Total* | $1,457,074,176 | 5.1 | 100 | - |
*Includes brands not listed.
Source: Information Resources Inc. (IRI), Chicago. Total U.S. supermarkets, drug stores, gas and convenience stores, mass merchandisers, military commissaries, and select club and dollar retail chains for the 52 weeks ending May 14.
Top seltzer/sparkling/ mineral bottled waters
(Individual brands)
| Private label | $467,239,264 | 11.9 | 20.2 | -0.7 |
| Sparkling Ice | $383,577,376 | 5.4 | 16.6 | -1.7 |
| La Croix | $286,262,880 | 64.7 | 12.4 | 3.7 |
| Perrier | $244,924,944 | 19.9 | 10.6 | 0.3 |
| San Pellegrino | $130,164,096 | 10 | 5.6 | -0.3 |
| Category Total* | $2,311,028,736 | 16 | 100 | - |
*Includes brands not listed.
Source: Information Resources Inc. (IRI), Chicago. Total U.S. supermarkets, drug stores, gas and convenience stores, mass merchandisers, military commissaries, and select club and dollar retail chains for the 52 weeks ending May 14.
Looking for a reprint of this article?
From high-res PDFs to custom plaques, order your copy today!
