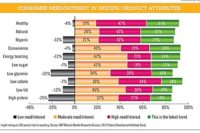
Healthy and natural attributes top the list of consumer needs and interests for beverages, according to respondents of Beverage Industry’s annual New Product Development Survey. Thirty-one percent of survey-takers believe these are the latest trends, while 66 percent report a consumer need or interest in these claims. Furthermore, almost half of respondents plan to increase the use of natural flavors and colors in their beverages in 2013 due to consumer demand, the desire for cleaner labeling and health reasons. By comparison, only 35 percent and 28 percent of respondents planned to increase their natural flavors and colors, respectively, last year.
This year also should see the launch of more new products compared with last year, according to survey results. Sixty-four percent of survey respondents plan to increase their new product launches in 2013 in response to consumer demand, company growth and new trends. Likewise, 42 percent expect their research and development budgets to increase in 2013 due to new products and more employees.
Flavors and colors
In 2012, most new product introductions continued to feature traditional flavors, according to survey-takers. The majority — 54 percent — of respondents reported using blueberry as a flavor in 2012, followed closely by berry flavors at 51 percent. In 2011, however, apple was selected as the most-used flavor, and blueberry was located in the No. 11 spot on the list. Nonetheless, berry remained in the No. 2 spot. Other popular flavors making up the Top 10 in 2012 include lemon, cherry, raspberry, apple, mango, orange, lime and strawberry. According to respondents, lime is making a comeback. The flavor ranked No. 21 on the 2011 list of most-used flavors; for 2012, it moved up 12 places to the No. 9 spot. Lemon and cherry also improved, moving up five and eight places, respectively. Superfruit acai dropped eight spots from 2011 to 2012 as one of the most-used flavors among respondents; however, it tied with apple and pomegranate as the No. 2 top-selling flavor in 2012 for respondents. Similarly, vanilla dropped eight spots from 2011 to 2012 on the list of the most-used flavors, but it ranked No. 6 as one of the top-selling flavors in 2012.
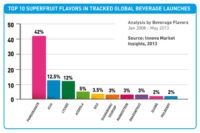
Strawberry was considered the top-selling flavor in 2012 by 20 percent of survey-takers. Other flavors making up the Top 10 best-sellers include acai, apple, pomegranate, orange, vanilla, berry, chocolate, coffee and peach. With both acai and pomegranate in the Top 5 on the 2012 top-sellers list, this might signify an increased consumer preference for exotic fruits or superfruits. For 2013, 19 percent of respondents expect vanilla to be their best-selling flavor, followed closely by strawberry at 18 percent. This is the second consecutive year that respondents have selected vanilla as the most anticipated top-selling flavor. Other forecasts for best-selling flavors this year include apple, mango, orange, peach, pomegranate, cherry, acai and chocolate. Plus, respondents opined that new or unique flavors for 2013 might include coffee, superfruits, exotic fruits, other fruit flavors, tea, cinnamon, coconut, elderflower and ginger, among others.
Fitting in with the consumer demand for natural products, respondents note that they will use more natural flavors than artificial flavors this year. Forty-two percent say that they will use 100 percent natural flavors; one-quarter plan to use between 76 and 99 percent; 21 percent expect to use between 51 and 75 percent; only 3 percent say they will use 26 to 50 percent; and 9 percent plan to use between 1 and 25 percent. On average, 81 percent expect to use natural flavors this year, which is an increase of 5 percentage points compared with last year’s survey results. Alternatively, no respondents noted plans to use 100 percent artificial flavors in their products this year. Thirty-seven percent say they will use between 1 and 25 percent artificial flavors; 10 percent plan to use between 26 and 50 percent; 4 percent expect to use between 51 and 75 percent; and 6 percent say they will use between 76 and 99 percent.
“I think this will be the trend,” one respondent stated in the survey. “I think consumers are more educated now when it comes to things of this nature and are wanting natural if they can get it.”
Natural colors seem to be increasing in popularity faster than flavors. According to the 2012 survey, an average of 76 percent of respondents plan to use natural colors this year, compared with 68 percent of respondents last year. Forty percent say they will use 100 percent natural colors this year; 27 percent expect to use between 76 and 99 percent; 7 percent plan to use between 51 and 75 percent; 10 percent say they will use between 26 and 50 percent; 12 percent plan to use between 1 and 25 percent; and only 3 percent do not plan to use any natural colors.
Trending attributes
When it comes to consumer trends, healthy and natural product attributes have overtaken convenience, which was ranked as the No. 1 latest trend in Beverage Industry’s 2011 New Product Development Survey. In the 2012 survey, the convenience trend fell to the No. 3 spot, followed by organic, energy, probiotic/prebiotic, low sugar, low calorie, high protein and country-of-origin labeling. It’s also important to note that 35 percent of respondents have greater concern for country-of-origin ingredients, compared with 21 percent of 2011 survey-takers. Fifty-five percent of 2012 respondents say they are just as concerned about the origin of ingredients as they were the previous year, and 10 percent are less concerned.
Respondents also ranked product attributes according to consumers’ interest in them, with 47 percent saying healthy attributes are a must-have for consumers. Forty-two percent say that natural and convenience attributes are must-haves for consumers. Of the health-related attributes, 19 percent say organic is a must-have attribute; 18 percent say probiotic/prebiotic is a must-have; 39 percent say low sugar is a must-have; 34 percent say low calorie is a must-have; and 26 percent say high protein is a must-have. On the functional side, 23 percent of respondents say energy is a must-have, which is a decrease of 9 percentage points from 2011 survey results.
The trend toward indulgence fell 16 places from the No. 7 spot in the 2011 survey to the No. 23 spot in the 2012 survey. Similarly, the beauty-enhancing trend fell 12 places from the No. 9 spot in the 2011 survey to the No. 21 spot in the 2012 survey, with 50 percent of 2012 survey-takers saying there is a low need or interest among consumers. On the other hand, the trend toward probiotic/prebiotic attributes rose 10 places from the No. 16 spot in the 2011 survey to the No. 6 spot in the 2012 survey.
The process
To accommodate plans for new product releases, 42 percent of survey-takers expect their research and development budgets to increase this year, while 53 percent think it will stay the same, and only 5 percent expect it to decline. Respondents also noted that the average cost to develop a new product is approximately $157,903, whereas 2011 respondents said it was $140,878.
Of the 2012 survey-takers, 58 percent are developing products in the water and juice categories; 51 percent are developing products in the sports and energy drinks categories; 27 percent are developing products in the wine, beer and spirits categories; and 22 percent are developing carbonated soft drinks. The most common motivator for a new product introduction is a customer request. Other reasons include expanding into new markets and consumer segments, increasing profitability, offering healthy alternatives to consumers, providing more options for consumers and responding to market trends, respondents say. To help bring these new products to market, 30 percent of survey-takers reported outsourcing part of their processes, whereas 42 percent of respondents from the previous year said they outsource part of their development processes. Fifty-nine percent of 2012 survey respondents report outsourcing their prototype development; 41 percent outsource market research; 35 percent outsource their concept and product testing; 12 percent outsource their post-launch analysis/evaluation; 6 percent outsource ideation; and another 6 percent outsource other things such as processing equipment.
According to respondents, customers are driving the most idea generation, with 72 percent of the vote. This is a change from the year before in which only 56 percent of 2011 survey respondents said customers are driving new product ideas. In 2011, marketing and salespeople were ranked No. 1 for new product ideas with consumer trends in a close second place. For 2012, marketing and salespeople shifted down to the No. 2 spot with 64 percent of the vote, followed by consumer trends with 62 percent of the vote. Consumer research and testing came in a close fourth place with 61 percent of respondents saying this is responsible for new product ideas. Fifty-nine percent say their new product ideas come from in-house meetings; 54 percent say it comes from their research and development department; 48 percent say ideas come from upper management; one-quarter get ideas from trade magazines; and 2 percent get new product ideas from other sources such as scientists. Sixty-two percent also say that their suppliers are involved in the process. Eighty-nine percent of respondents say that during the new product development process, their suppliers provide raw materials and ingredients; 76 percent say they provide technical support and expertise; 59 percent say they offer samples; 51 percent say they aid in formulation; 43 percent say they offer ideas; and 14 percent say they provide consumer research and merchandising ideas.
The majority of respondents (92 percent) also note that they use a team approach to new product development. Eighty-seven percent say that sales and marketing departments are regularly included on a new product development team; 78 percent say their research and development department is regularly included; 65 percent say their upper management is regularly included; 53 percent say their production department is regularly included; 36 percent say their quality assurance/quality control department is regularly included; 31 percent say their packaging department is regularly included; 29 percent say their customers are regularly included; 27 percent say their finance/accounting department, purchasing department and suppliers are regularly included; 16 percent say their engineering department is regularly included; and 5 percent say other departments such as applications, food safety and regulatory labeling are regularly included. Among those who indicated that upper management is included in their new product development teams, 89 percent say that their chief executive officers are involved in the new product development process. Within the development process, 41 percent say their chief executive officer acts as a leader/decision-maker; 38 percent say their chief executive officer takes an advisory/guidance role; 16 percent say their chief executive officer acts as a team member; 3 percent say their chief executive officer only gives the final approval; and another 3 percent say their chief executive officer provides ideas.
In 2011, survey respondents noted that it takes 9 months, on average, to take a new product from inception to launch. For 2012, respondents upped the timeframe to 10 months, on average. They also nearly doubled the number of new products developed in 2012. In 2011, survey respondents said they each developed 16 products, on average. In 2012, respondents say they each developed 31 new products, on average. However, the number of new products that were actually released in 2011 and 2012 remained about the same, according to survey-takers. Respondents from both the 2011 and 2012 surveys said they released about seven new products in their respective years. In 2011, respondents noted that about five of the seven products they released were successful. Of the seven products released in 2012, approximately six of them were successful, respondents say. Reasons for new product failure include poor marketing execution, cost/value, taste and appearance issues, lack of testing/sampling, lack of consumer understanding/awareness and simply having a poor idea. Nevertheless, 64 percent of respondents say they plan to increase the number of products launched in 2013. Thirty-four percent of survey-takers say they will launch the same number of products this year, and only 2 percent plan to decrease their new product launches. One respondent explained that instead of focusing on new product lines in 2013, his or her company will work on mergers and acquisitions. Of the respondents that plan to increase their new product launches, 31 percent say they plan to increase the number of launches by between 31 and 50 percent; 19 percent say they expect to increase the number by between 21 and 30 percent; 17 percent say they plan to increase the number by between 11 and 20 percent; another 17 percent plan to increase the number by between 6 and 10 percent; 11 percent expect to increase the number by 100 percent; 3 percent say they expect to increase the number by between 51 and 99 percent; and another 3 percent say they plan to increase the number by less than 5 percent.
When asked to rank the most important steps in a new product development plan, 65 percent of respondents said final product development is extremely important, followed by concept and product testing, prototype development, launch, production, market research, ideation and post-launch analysis/evaluation. In 2011, survey respondents placed the highest importance on launch and final product development, followed closely by production. Forty percent of 2012 survey-takers believe market research is extremely important. Within the market research segment, in-store testing is used most commonly by respondents, with 53 percent of the vote, followed by focus groups, consumer panels, consumer surveys, central location testing, one-on-one, home-use test and mail intercepts. BI
Beverage Industry’s New Product Development survey was conducted by BNP Media’s Market Research Division. The online survey was completed between Sept. 28 and Oct. 19, 2012, and included a systematic random sample of the domestic circulation of Beverage Industry and its sister publications Dairy Foods and Prepared Foods.
Of the respondents, 62 percent process juice and juice drinks, 39 percent process dairy-based beverages, 34 percent process coffee and tea, 28 percent process energy drinks, 27 percent process water, 25 percent process sports drinks, 23 percent process carbonated soft drinks, 15 percent process wine, 13 percent process spirits, and 10 percent process beer.
Thirty percent of respondents were from companies with less than $10 million in annual revenue. A total of 27 percent were in the mid-size company range — $10 million to $100 million. Reporting $100 million to less than $1 billion in revenue were a total of 22 percent of respondents. Twenty percent of survey-takers were from companies reporting more than $1 billion in annual revenue.
On a regional basis, 59 percent of respondents have a business presence in the Northeast, 74 percent have representation in the South, another 70 percent said their companies can be found in the West, and 65 percent have business in the Midwest.
Thirty-eight percent of respondents are in research and development positions within their companies, followed by 28 percent in sales and marketing positions. Twenty-four percent of survey-takers represent upper management positions. Quality control and quality assurance, purchasing and other titles made up the remainder of the sample.
For more information, please visit www.clearseasresearch.com.


