2011 New Product Development Survey
Beverage development in 2010 continued to strive to keep up with consumer demand for variety, which in this year’s survey was highlighted by a return to traditional flavors, according to Beverage Industry’s annual New Product Development survey. Perennial top flavors chocolate, vanilla and strawberry remained popular choices for survey respondents, but superfruits were de-throned by more traditional fruit flavors, especially citrus. The survey also showed that consumers’ desire for natural, healthy and convenient products continue to drive development.
The New Product Development survey found that 45 percent of respondents plan to launch more new products into the marketplace in 2011, while 44 percent plan to launch the same number. Driving new product introductions are consumer demands, changing tastes and the need to create excitement in a product line, according to survey-takers. Popular responses also included “health and wellness,” “profitability,” “all natural flavors/products” and “gaining market share.”
The majority of respondents to the New Product Development Survey focused on non-alcohol beverages. Fifty-seven percent identified water and juice products to be the focus of their new product development, and 52 percent will dedicate resources to new sports and energy drinks. In addition, 24 percent said they are working on new beer, wine and spirit products. This represents a decrease from 2010’s survey figure of 30 percent of those polled who indicated that they expected to create new alcohol beverages. Carbonated soft drinks were a focus for 23 percent of those polled, which is an increase from 2009’s 14 percent of respondents.
To keep up with the market, 60 percent of beverage-makers polled anticipate company research and development budgets will stay the same as budgets in 2010. Thirty percent forecasted an increase in research and development budgets for reasons that include “focus on higher quality products,” “increased pressure to meet customer needs in a changing market,” as well as increasing projects, staff and resources. The reasons were mainly economical for the 10 percent of respondents who indicated R&D investments will decrease, including lack of budget, costs and a weak economy. One respondent who anticipated a decrease in R&D budget for 2011 indicated its “focus is on expanding existing product line and not adding newly developed items.”
The average investment for new product development from concept to consumer was about $46,000 in 2010. A budget between $1,000 and $25,000 was indicated as the cost for 46 percent of survey-takers, while 42 percent said they spent in the range of $25,001 to $100,000 on development.
Traditional variety
Consumers continue to demand variety, which was reflected in the results through a change in top-selling flavors. In 2010, superfruit flavors gave way to more traditional fruit flavors, such as lemon, orange and lime.
The top five best-selling flavors in 2009 were as follows: vanilla, chocolate, strawberry, pomegranate and acai. In 2010, companies reported chocolate, vanilla and strawberry varieties, but lemon and orange took the place of pomegranate and acai. Although pomegranate continued to rank in the top 10, acai fell to fourteenth on the list. In 2010, tea in general was slightly more popular than green tea and coffee fell from the top 10 to No. 18 in this year’s survey. Mango was a top 10 flavor in 2009, but fell 10 spots on this year’s list of top-selling flavors, according to survey results.
The trends were in favor of lemon, which ranked as No. 2 on 2010’s top-selling flavors list. The citrus fruit ranked as the top flavor used in 2010 with 46 percent of respondents indicating that they used the citrus fruit last year. The forecast also is bright for the flavor as it was ranked as the second most anticipated top-selling flavor for 2011. Fellow citrus flavors orange and lime also were popular top-sellers, used flavors and anticipated top-sellers, according to survey answers.
Overall, fruit dominated the list of most used flavors in 2010. In 2009, 47 percent of respondents ranked both mango and orange as the most popular beverage flavors. While 45 percent of respondents used orange in 2010, only 40 percent chose to formulate with mango. Pomegranate also fell to 40 percent from 2009’s 44 percent ranking. This year’s survey identified new entries to the top 10, including berry, with 42 percent popularity, and peach and raspberry each had 40 percent. The same percentage of respondents also chose apple and blueberry, which also were in the top 10 most used flavors from the 2010 survey. Dropping from the most popular flavors in 2010 were vanilla, chocolate and acai. Of the three, acai had the most dramatic decline falling to 26 percent from 40 percent in 2010.
As with last year’s survey, chocolate retains its top spot as the anticipated best-selling flavor for 2011. Lemon entered the top 10 and tied with vanilla as the flavors forecasted to be second most popular in this year’s survey with 15 percent each. In last year’s survey, vanilla ranked second and was followed by acai, pomegranate and strawberry. The top three fruit flavors of 2009 each decreased last year, with pomegranate ranking highest as it tied with new top 10 entries lime and orange as the choice of 14 percent of survey-takers. Also entering the top 10 in 2010 were cherry and cola flavors, which were both selected by 13 percent of respondents. The biggest forecasted decreases are coffee and mango, which were both top 10 flavors in 2010, but captured only 6 and 7 percent of the selections, respectively.
Naturally rising
Thirty-eight percent of respondents indicated that both natural and healthy are attributes that consumers must have. On average, a majority of survey-takers are keeping in line with this trend by planning to use natural flavors and colors in 2011. Only 7 percent of respondents indicated they have no plans to use natural flavors and colors this year. The remaining majority reported they will use some proportion of natural ingredients. Only 28 percent indicated they will use 100 percent natural flavors and 37 percent opting for wholly naturally derived colors.
Although many of those polled already formulate with natural ingredients, the majority of survey-takers responded that they do not have plans to increase natural flavor or color usage in 2011. For natural flavors, 58 percent said they do not plan to increase usage. Those who indicated that they will increase usage of natural flavors plan to do so primarily because of consumer and market demands, responses show. Natural colors had a higher response rate as 68 percent indicated they will not increase usage of the ingredient this year. Consumer and market demands also are inspiring the 32 percent of companies that plan to increase natural color usage in 2011.
In addition to consumer desires, beverage-makers said that they will switch to natural flavors and colors indicated costs, company mandates and sales strategy as reasons for their choice. According to respondents, 36 percent plan to use no artificial flavors and 43 percent will not use artificial colors in beverage formulations in 2011. Artificial ingredients are still being used, however, as high as a quarter of respondents indicated they will use 1 to 25 percent artificial flavors and 26 to 50 percent artificial colors in formulations this year.
When purchasing ingredients, the amount of respondents having a greater concern about country-of-origin decreased to 24 percent of those polled compared with 30 percent in 2009. For those reporting a greater concern, quality considerations and increased consumer awareness and government regulations top the list of reasons why they are paying more attention to the country-of-origin of their ingredients. In this year’s survey, 71 percent said they will have the same amount of concern regarding the source of ingredients with 5 percent indicating that they will have less. Last year’s survey detailed that 64 percent of survey-takers reported that they will have about the same considerations.
Supplying demand
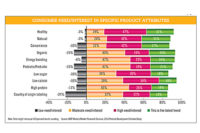
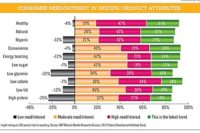
Consumer demand for new products that are natural, healthy and convenient drove new product development in 2010, according to the survey. Demand for products with natural attributes was identified as the latest trend by 44 percent of respondents. Healthy was the second highest forecasted trend with 40 percent indicating the better-for-you priority. The responses also were the top two trends in last year’s survey, but both increased 10 percent in 2010. In addition, in 2010, 30 percent of those polled identified convenience as a popular consumer need.
Thirty-eight percent also indicated that both natural and healthy are attributes that consumers must have. Convenience topped the list of consumer must-haves with 53 percent of the responses. Also high on consumers’ priority lists were low-calorie with 49 percent; low-sugar, at 42 percent; and low-fat receiving 39 percent of responses.
Remaining in tow with last year’s results, energy boosting benefits maintained the fourth place spot in the top 10 most sought after product attributes. Although in the same spot, energy boosting benefits increased its share with 29 percent indicating it’s the latest trend, compared with 20 percent of respondents in 2009.
The better-for-you beverage trend has influenced development as organic, low calorie and low fat all increased in popularity in 2010. Organic grew the most as 23 percent of survey-takers said it’s the latest trend, compared with 12 percent of respondents in 2009.
Declining in 2010 were low salt, vitamin and mineral fortified and low glycemic product attributes. Low salt dropped five places despite the fact that more respon-dents – 32 percent – indicated reduced sodium as a high consumer want or need. In last year’s survey, low salt was a more popular trend, but only 23 percent of survey-takers said it was of high need or interest to consumers. A similar decline was seen by vitamin and mineral fortified attributes, which fell from sixth place in 2010’s survey to an 11th place ranking.
Beauty-enhancing ingredients entered the top 10 in 2010 with 40 percent of respondents saying the ingredients are of moderate need or interest to consumers. Additional trends on the radar include relaxation benefits, probiotics and prebiotics, gluten-free and ethnic. The somewhat contradictory trends of indulgent and portion controlled were chosen as a high need or interest to consumers by 35 and 30 percent of respondents, respectively. Thirty percent of survey-takers also indicated high protein and whole grain to be perceived high priorities for consumers.
As indicated by the shuffling of product attributes, changing consumer trends often have a strong impact on new product idea generation. This year’s survey results showed consumer trends tied for first with input from chief executive officers and upper management as the strongest influences of new product idea generation. Both tied for first with 61 percent of responses in 2010, while in 2009, 67 percent of survey-takers said chief executive officer and upper management were responsible for new product ideas. In 2009, marketing and sales input tied for second with customer demands, which slightly switched in 2010 with 57 percent indicating customer demand as a driving force for development, and 56 percent responding that marketing and sales have a strong input. Also on the list of contributors to new product ideas were R&D departments, in-house teams and meetings, consumer research and testing, and trade magazines.
Correlating with the strong influence of chief executive officers in new product idea generation, 79 percent of respondents indicated that their chief executive officer is involved in the new product development process. Of those, 44 percent indicated that the chief executive officer oversees, advises or guides development; 29 percent said he or she is a leader or decision maker; 10 percent indicated that the official provides final approval; the same percentage also responded that he or she is a team member; and 7 percent said their chief executive officer is the initiator of development.
Although upper management has an influence on the process, 87 percent of respondents operate under a team approach during new product development. Sales and marketing team members continue to dominate the development teams with 83 percent of survey-takers including the personnel on the projects. Research and development personnel, upper management and production employees also are most frequently included during the new product development process.
A small increase was seen in the percentage of respondents that outsource portions of their new product development. In last year’s survey, a quarter reported they sought outside help, while in 2010, 28 percent indicated outsourcing was part of their development process. Within the percentage that outsources portions of development, 68 percent indicated they seek assistance for prototype development, 36 percent for market research and 29 percent for concept and product testing. Prototype development saw the strongest uplift in 2010 increasing to the majority of responses from 44 percent in 2009.
In this year’s poll, respondents were evenly split as to whether or not suppliers were involved in the product development process. In 2009, 60 percent indicated they included suppliers in the development process. Although not as many companies are collaborating with suppliers, the reasons for those who do is similar to last year’s results: 94 percent of suppliers involved in the new product development process provide ingredients and raw materials, 76 percent are on board for technical support and expertise and 71 percent provide assistance with samples. Also in the majority are suppliers that contribute during the formulation stage, survey-takers said.
For the 50 percent of companies that work with their suppliers, the numbers have switched a bit from last year’s survey. The rankings remain the same, but in 2010, 51 percent involved suppliers at the beginning stage, which is after product inception and through to completion, compared with 61 percent of respondents in 2009. A slight increase – 35 percent from 2009’s 30 percent – was shown in companies that collaborate from the idea stage through to product completion, according to the survey. In addition, 12 percent of companies involve suppliers after formulation through completion, which is an increase from 2009’s figure of 7 percent. Remaining unchanged from last year’s survey, two percent of companies work with suppliers in the final stages of development.
New product launches
In 2010, the average time to develop a new beverage from inception to final product launch increased to 10 months, which is a one-month increase from 2010’s survey. About the same amount as last year’s survey – 39 percent compared with to 2010’s 40 percent – indicated their development timeline is between six to nine months. Aligning with the 21 percent of survey-takers who said their product development timeline was faster in this year compared to last, 10 percent of respondents reported their timeline for development was two months or less. In 2009, only 1 percent of respondents said they work on a rapid timeline.
This year’s survey showed 14 percent of those polled reported that their timeline is between three and five months, 18 percent take 10 to 12 months on innovation and 10 percent work on a 13 to 18 month timeline. The timelines fit in with the 69 percent of respondents who reported that their development pace stayed in step with last year’s poll. Ten percent of respondents said they are working on development more slowly, which is reflected in the two-point increase – to 8 percent – of companies that take 19 or more months to develop a product.
When looking back at survey responses, development statistics are on the upswing from the low number reported in last year’s results. In 2009, companies released an average of 12 new products, which was a decrease from the average of 18 new products launched in 2008. In 2010, the average was 16 products. A quarter of respondents indicated they developed three to four new products, which was followed by 21 percent that created 10 to 24 new products.
From 2010’s average of 16 new products developed by survey-takers, an average of nine of those products made it to market, they said. This is a decrease from the 11 average new products launched to retail in 2009. In 2010, just shy of a quarter of respondents launched two or fewer products and 20 percent indicated they launched three to four and another 20 percent introduced five to nine new products to the market in 2009. The percentage of respondents that did not launch any new products in 2010 remained at the previous year’s level of 12 percent.
Of the nine products that on average debuted in the marketplace in 2010, six were considered successful by their company’s standards, respondents said. In 2009, only five of the 11 products introduced to the market were considered successful. In 2010, the proportions of success varied from 26 percent reporting one or two of its new products were successful, 20 percent indicating three to four did well and 19 percent identifying five to nine new products performed well. Close behind were 16 percent of respondents who indicated none of their products were considered successful in 2010. The number of companies that had 25 to 74 new products that were successful increased from 1 percent in 2009 to 5 percent in 2010, according to the survey.
Forecasts for planned new product launches for 2011 remained in step with last year’s predictions. As with last year’s poll, 45 percent of survey-takers said they plan to launch more new products in 2011 compared with 2010 and 44 percent reported their development will stay the same. An increase of 1 percent was seen in the number of companies that plan to decrease the amount of new products, changing to 12 percent. For those who reported a plan to decrease their product launches, 46 percent said they will do so by between 26 and 50 percent.
The 45 percent of survey-takers planning on increasing the number of new products will do so because of consumer demand, growth opportunities and increased resources for the R&D process, said several respondents. One survey-taker said, “[We are] devoting more time to the process,” and another explained they are “Making up for lost volume.” The desire to focus on existing products and lines was reported by a portion of the 12 percent who plan to decrease their new product development in 2011. “Too much in the pipeline to get the proper amount of attention,” was one respondent’s reason, while another said, “We have just released plenty of new products and we want to focus on enhancing our existing lines.”
Launch plan
In 2010, an increased amount of respondents – 64 percent compared with 59 percent in 2010’s survey – reported their company has a definitive new product development plan. Decreasing from 2009’s rate of 73 percent, 64 percent of survey-takers said their company conducts a post-launch assessment.
Market research remains an integral portion of the product development process with 60 percent of respondents indicating it is extremely important. According to this year’s survey, consumer panels were the most popular market research method with 57 percent of respondents indicating they choose to host panel discussions. This is an increase from 50 percent in 2010’s survey. Formerly the top choice for market research, focus groups decreased from 67 percent to 56 percent in 2010. In-store testing also decreased with 36 percent opting for retail interaction in 2010 compared with 58 percent in 2009. Additional methods include one-on-one testing, consumer surveys, home-use test and central location testing, results showed.
Sampling overtook online and electronic media as the preferred plan for new product marketing going into 2011. This method is the most used and increased the amount of respondents who plan on sampling. In 2010’s survey, 38 percent planned to boost sampling and this year 44 percent intend to reach out to consumers to try their product. The numbers remained even between 2010 and 2009 for the 44 percent of companies intending to maintain the same amount of sampling.
Online marketing occupied the top spot of intended marketing in last year’s survey results. For 2011, a slight decrease was reported in the number of companies planning on reaching out to consumers via the Internet. Forty-three percent intend to increase their use of online marketing and 27 percent plan to maintain levels of Internet outreach on par with 2010. More companies reported they used online marketing in 2010, with a 5 percent decrease in the number of companies that do not reach out online.
Increasing in popularity this year will be the promotion of new products at retail. In last year’s survey, one-third of respondents indicated they would increase their use of point-of-purchase and in-store displays as well as retail promotions. Point-of-purchase and in-store displays were chosen by 42 percent of respondents as a method of outreach they plan on increasing. Retail promotions also are slated to increase with 39 percent of companies indicating they will reach out in-store. The percentage of respondents planning on maintaining their current levels of retail display and promotion remain in step with 36 percent for displays and 39 percent for promotions, respectively. Coupons remain a dominant force in marketing with a total of 57 percent using the same or more of the discounts in 2011.
Beverage Industry’s New Product Development Survey was conducted by Clear Seas Research. The online survey was completed between Oct. 18 and Nov. 1, 2010, and included a systematic random sample of the domestic circulation of Beverage Industry and its sister publications, Dairy Foods and Prepared Foods.
Beverages were the focus of develop-ment for 96 percent of respondents with 47 percent that process juice and juice drinks, 32 percent energy drinks, 30 percent coffee and tea, 29 percent water, 28 percent dairy-based beverages, 27 percent soft drinks and 26 percent sports drinks. Alcohol makes up the remainder of the category total.
Thirty-eight percent of respondents were from companies with less than $10 million in annual revenue. Thirty percent were in the mid-size company range - $10 million to $100 million. Seventeen percent of survey-takers were from companies reporting more than $1 billion in annual revenue.
On a regional basis, 19 percent have a product presence in the Northeast, 34 percent in the South, 36 percent in the West and 11 percent in the Midwest.
Thirty-eight percent of survey-takers represented upper management positions, 25 percent in sales and marketing positions, 23 percent in R&D, and 6 percent in production. Quality control and quality assurance, packaging, purchasing and other made up the remainder of the sample. BI
Looking for a reprint of this article?
From high-res PDFs to custom plaques, order your copy today!


